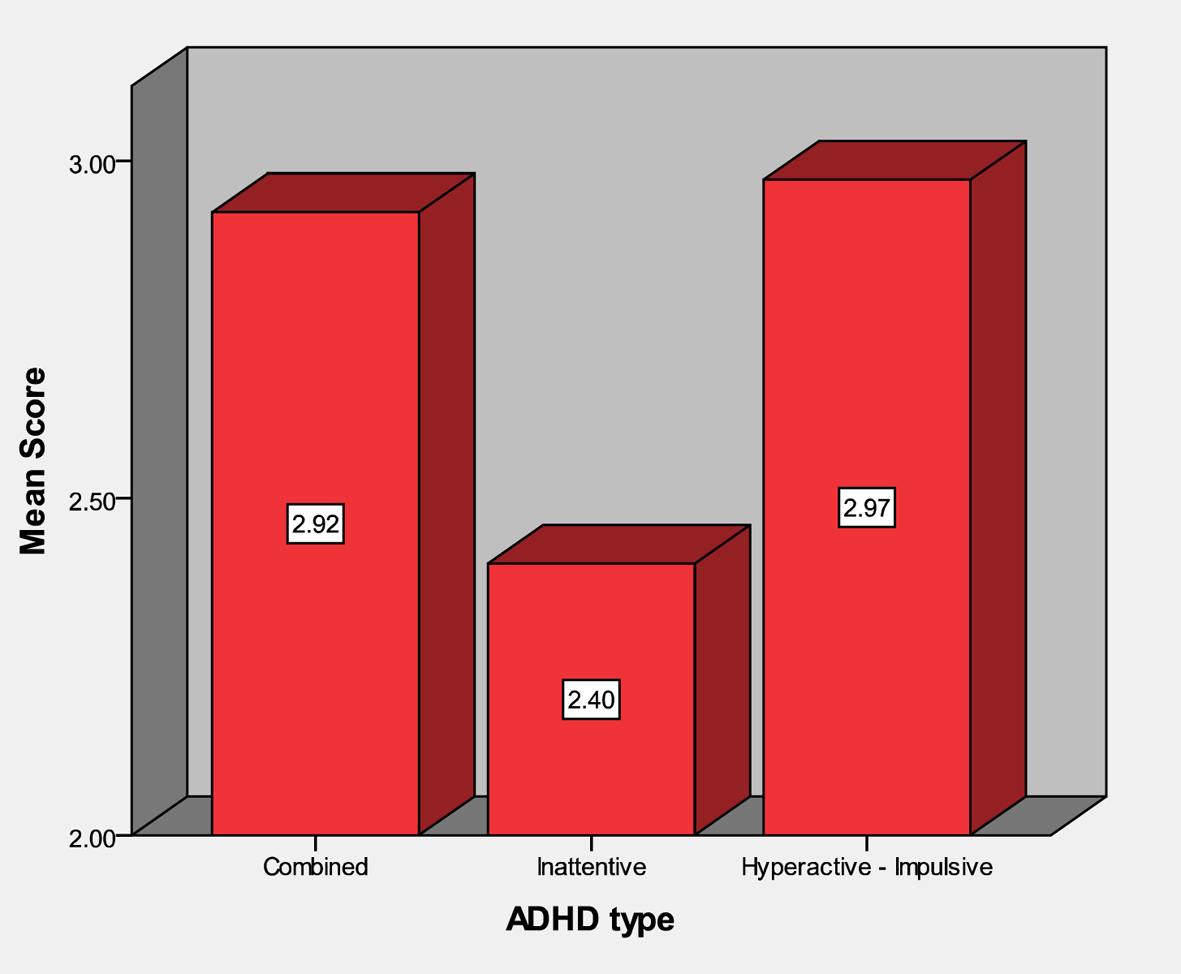
Figure 1. Comparison of learning disability scores in ADHD subtypes.
| Journal of Neurology Research, ISSN 1923-2845 print, 1923-2853 online, Open Access |
| Article copyright, the authors; Journal compilation copyright, J Neurol Res and Elmer Press Inc |
| Journal website http://www.neurores.org |
Original Article
Volume 4, Number 1, February 2014, pages 22-30
Learning Disabilities in Different Types of Attention Deficit Hyperactivity Disorders and its Relation to Cortical and Brainstem Function
Figures
Tables
| Mean | SD | P value | |
|---|---|---|---|
| Patients | 2.81 | 0.51 | 0.000*** |
| Control | 3.52 | 0.39 |
| Mean | SD | P value | |
|---|---|---|---|
| ADHD-C | 2.92 | 0.46 | 0.019* |
| ADHD-I | 2.40 | 0.52 | |
| ADHD-HI | 2.97 | 0.39 |
| Wave | Group | Mean | SD | P value |
|---|---|---|---|---|
| Wave I | Patients | 1.49 | 0.09 | 0.116 |
| Control | 1.52 | 0.09 | ||
| Wave II | Patients | 2.53 | 0.14 | 0.644 |
| Control | 2.54 | 0.14 | ||
| Wave III | Patients | 3.58 | 0.19 | 0.025* |
| Control | 3.50 | 0.13 | ||
| Wave IV | Patients | 4.68 | 0.20 | 0.018* |
| Control | 4.60 | 0.15 | ||
| Wave V | Patients | 5.51 | 0.25 | 0.006** |
| Control | 5.38 | 0.19 | ||
| Interval I-III | Patients | 2.08 | 0.19 | 0.001** |
| Control | 1.99 | 0.11 | ||
| Interval III-V | Patients | 1.94 | 0.15 | 0.035* |
| Control | 1.89 | 0.13 | ||
| Interval I-V | Patients | 4.02 | 0.24 | 0.001** |
| Control | 3.87 | 0.18 |
| Wave | ADHD subtype | Mean | SD | P value |
|---|---|---|---|---|
| Wave I | ADHD-I | 1.49 | 0.08 | 0.971 |
| ADHD-C | 1.50 | 0.10 | ||
| ADHD-HI | 1.50 | 0.00 | ||
| Wave II | ADHD-I | 2.54 | 0.12 | 0.202 |
| ADHD-C | 2.54 | 0.12 | ||
| ADHD-HI | 2.40 | 0.20 | ||
| Wave III | ADHD-I | 3.78 | 0.22 | 0.000*** |
| ADHD-C | 3.53 | 0.11 | ||
| ADHD-HI | 3.43 | 0.21 | ||
| Wave IV | ADHD-I | 4.77 | 0.24 | 0.167 |
| ADHD-C | 4.68 | 0.17 | ||
| ADHD-HI | 4.53 | 0.21 | ||
| Wave V | ADHD-I | 5.76 | 0.28 | 0.002** |
| ADHD-C | 5.45 | 0.20 | ||
| ADHD-HI | 5.37 | 0.23 | ||
| Interval I-III | ADHD-I | 2.27 | 0.20 | 0.001** |
| ADHD-C | 2.03 | 0.14 | ||
| ADHD-HI | 1.93 | 0.21 | ||
| Interval III-V | ADHD-I | 1.98 | 0.19 | 0.614 |
| ADHD-C | 1.92 | 0.14 | ||
| ADHD-HI | 1.93 | 0.06 | ||
| Interval I-V | ADHD-I | 4.24 | 0.29 | 0.002** |
| ADHD-C | 3.95 | 0.18 | ||
| ADHD-HI | 3.87 | 0.23 |
| Variable | Correlation coefficient (r) | P value |
|---|---|---|
| Inattention | -0.310 | 0.051 |
| Hyperactivity | 0.135 | 0.406 |
| Wave I | 0.164 | 0.313 |
| Wave II | 0.028 | 0.862 |
| Wave III | -0.412 | 0.008** |
| Wave IV | -0.343 | 0.030* |
| Wave V | -0.400 | 0.011* |
| I-III interval | -0.474 | 0.002** |
| III-V interval | -0.173 | 0.287 |
| I-V interval | -0.464 | 0.003** |
| Epileptiform activity | -0.313 | 0.049* |