Figures
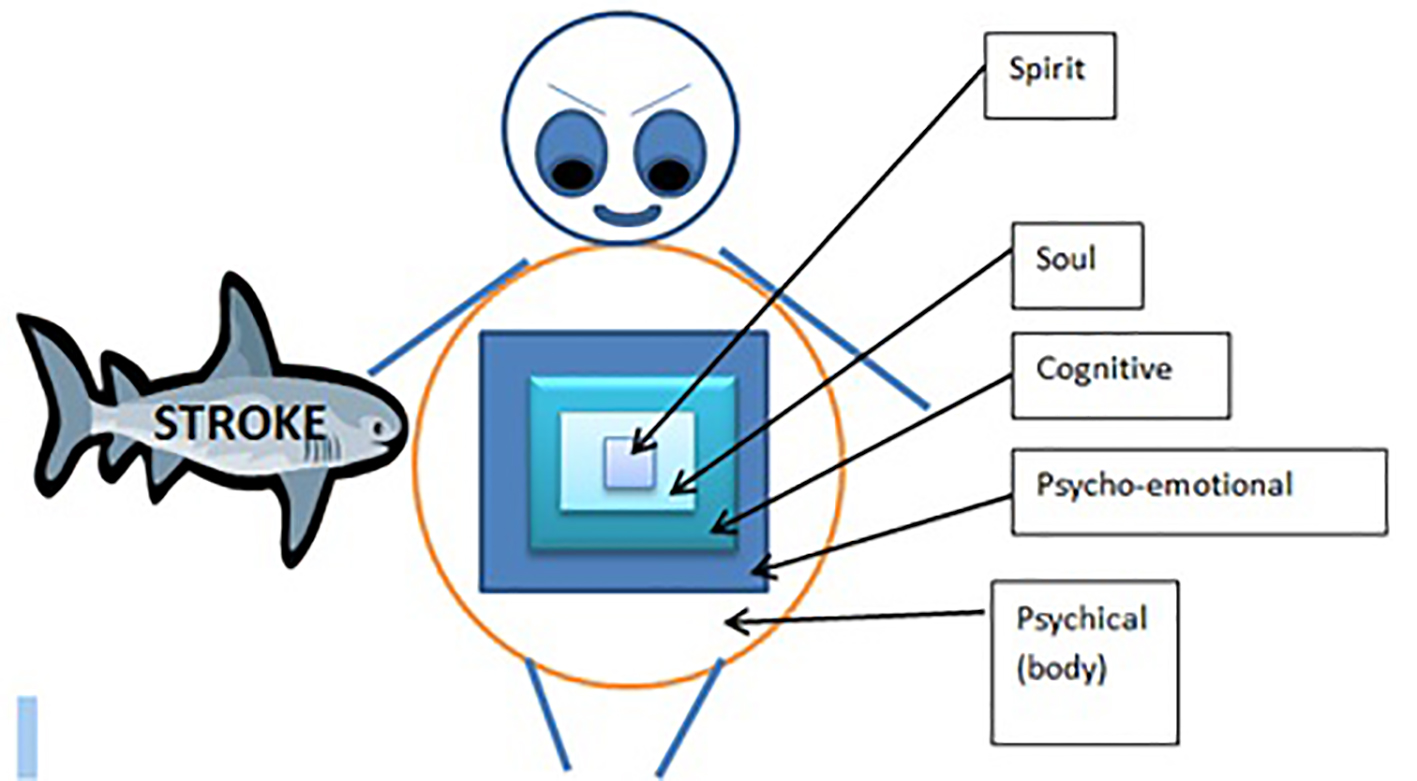
Figure 1. Seed of life model (SOLM). The seed of life model shows that the human is like a matryoshka doll. The spiritual sphere comprising of the spirit and the soul domains of quality of life represent the inner most protected core dolls. The physical sphere comprising of the physical, psycho-emotional and cognitive domains represent the outermost dolls that are vulnerable to external damage such as that caused by stroke.
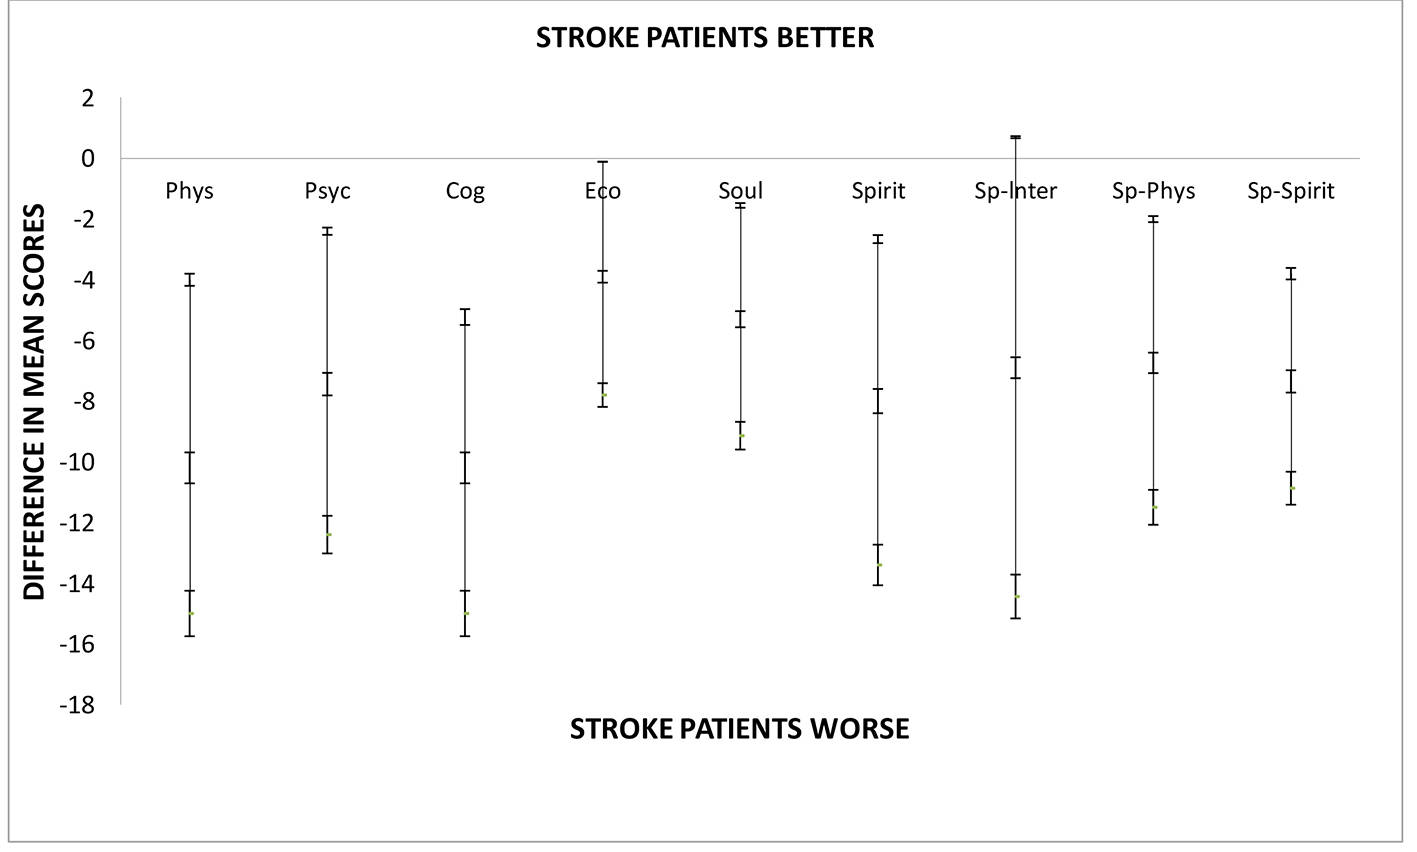
Figure 2. Difference between mean HRQOLISP scores in each domain of QOL for stroke patients and apparently healthy adults at the UHWI. As shown stroke patients were doing significantly worse in all domains except the spiritual interaction domain. Sp-Spirit: spiritual sphere; Sp-Phys: physical sphere; SpInt: spiritual interaction domain; Spirit: spirit domain; Phys: physical domain; Psyc: psycho-emotional domain; Cog: cognitive domain; Psyc: psycho-emotional domain; Phys: physical domain.
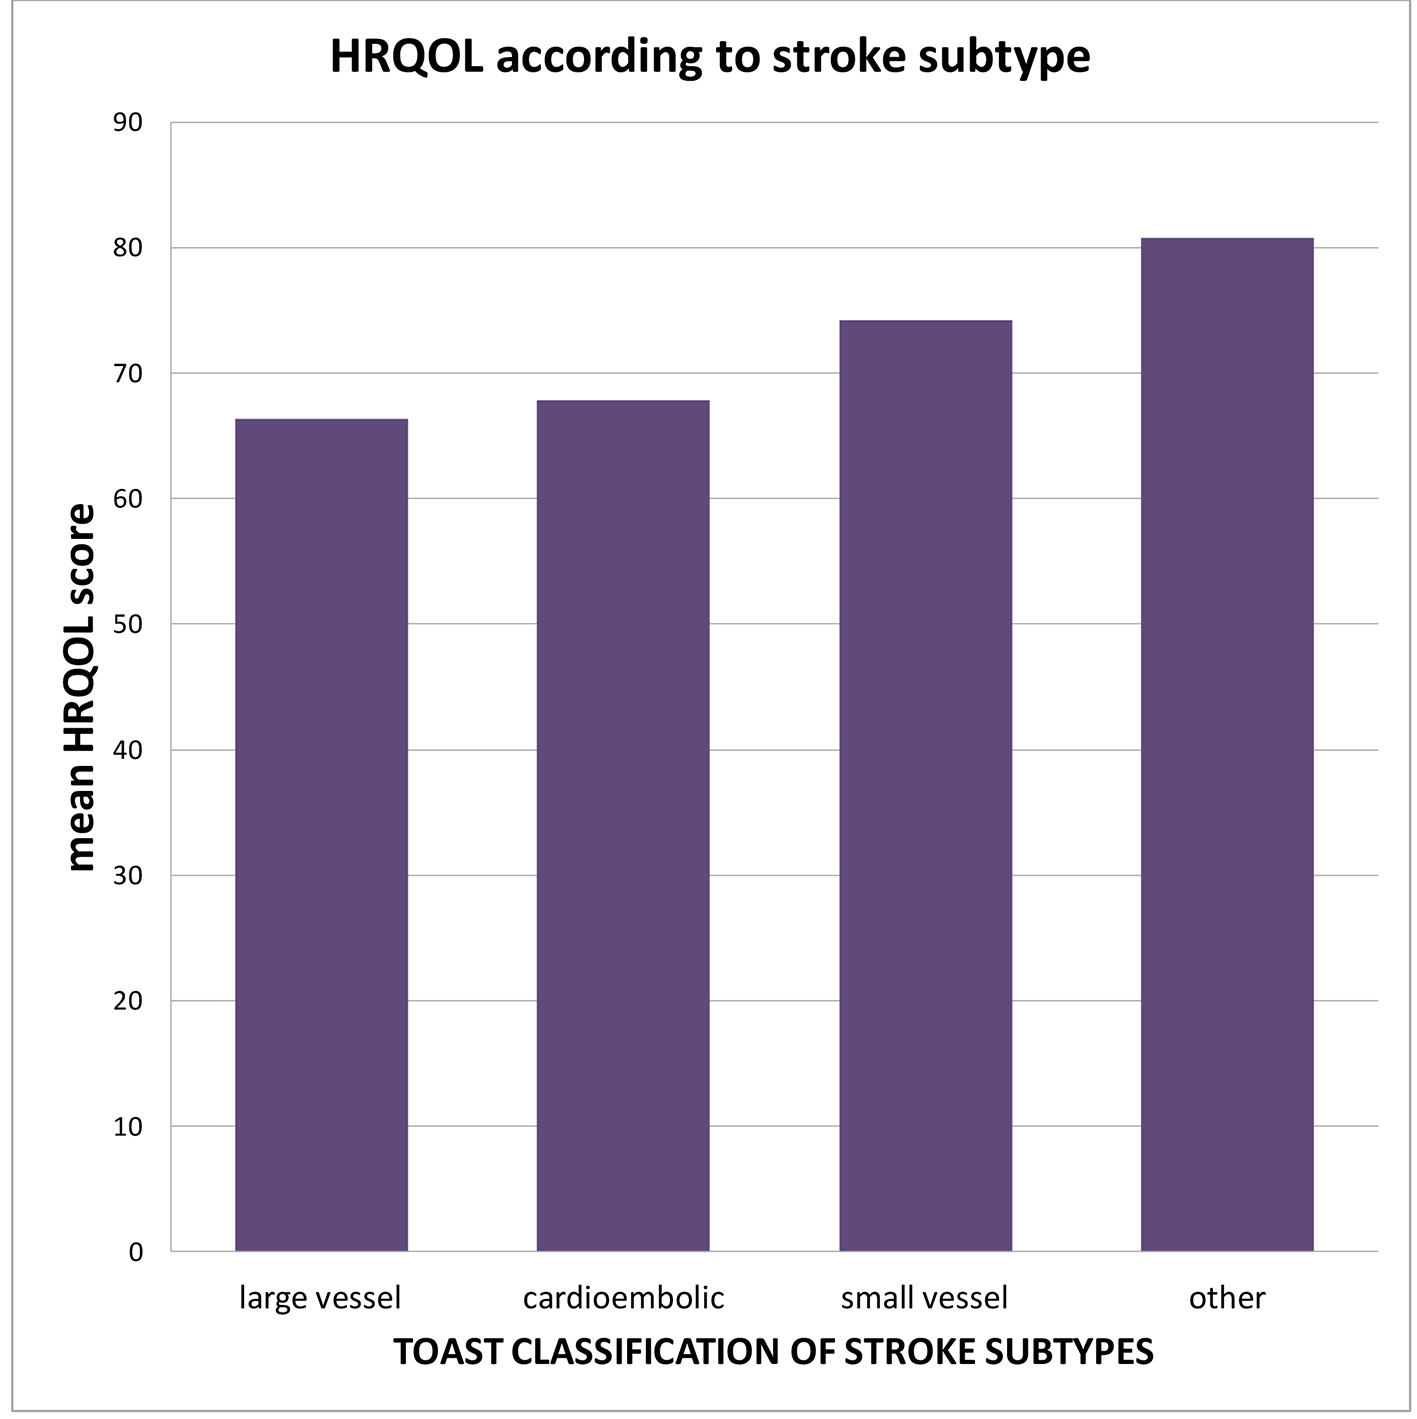
Figure 3. Mean HRQOL scores within each subtype of ischemic stroke. Large vessel and cardioembolic strokes were associated with lower HRQOL mean score when compared to small vessel arteriosclerotic subtype.
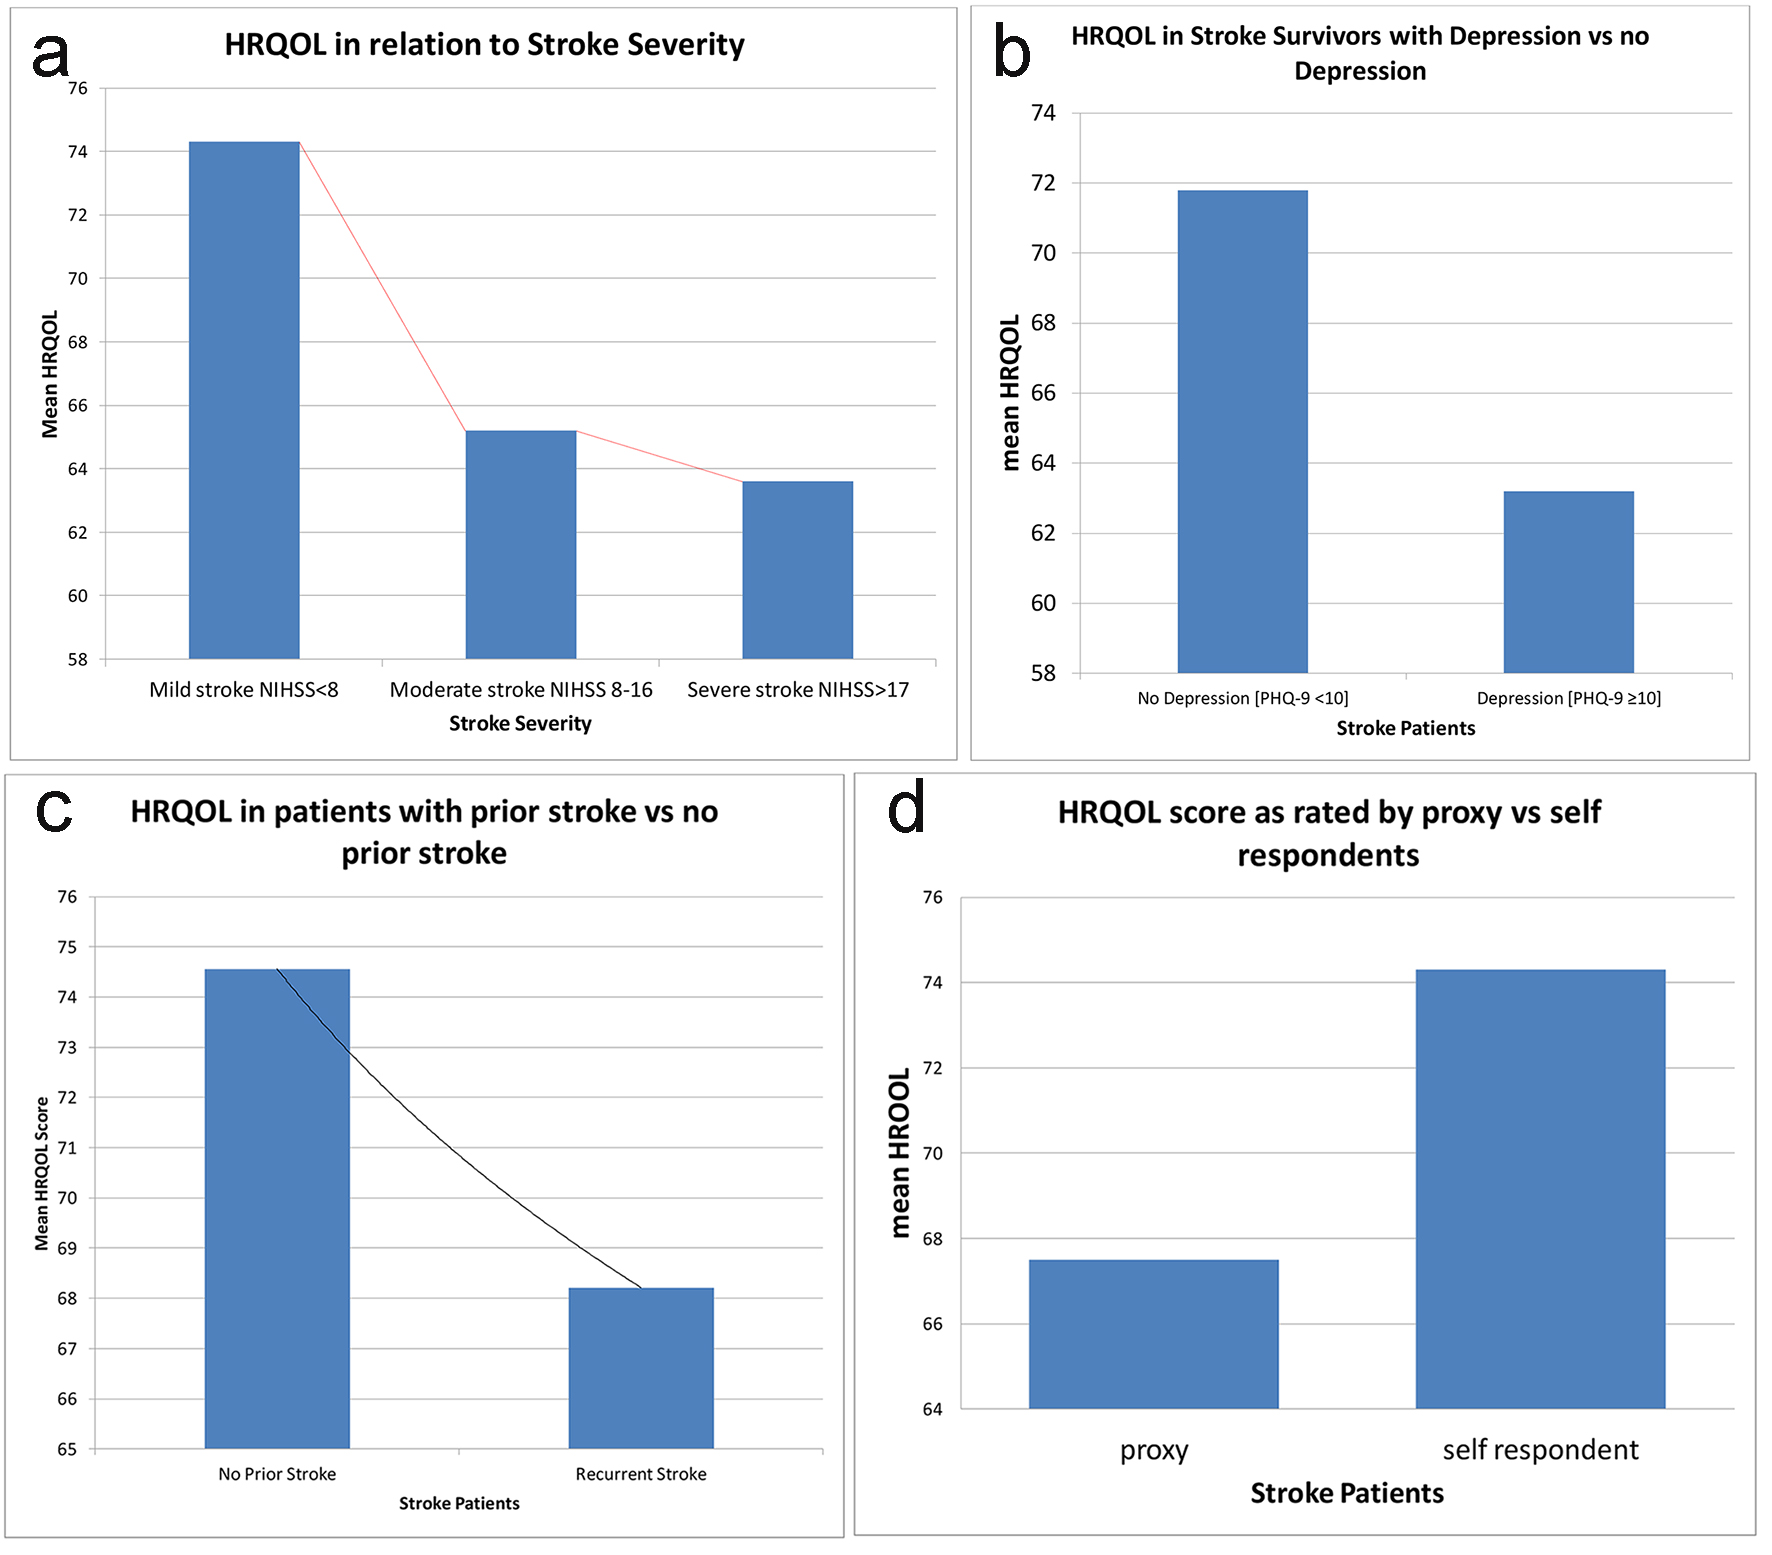
Figure 4. Variables that were significantly associated with worse HRQOL in stroke patients at UHWI. (a) Decreasing mean HRQOL with increasing stroke severity as measured by NIHSS (P = 0.0046). (b) Decrease in mean QOL if depression was present (P = 0.0040). (c) Decrease in mean QOL if the patient had a prior stroke (P < 0.05). (d) Decrease in mean QOL if the HRQOLISP was being completed by a proxy (P < 0.05).
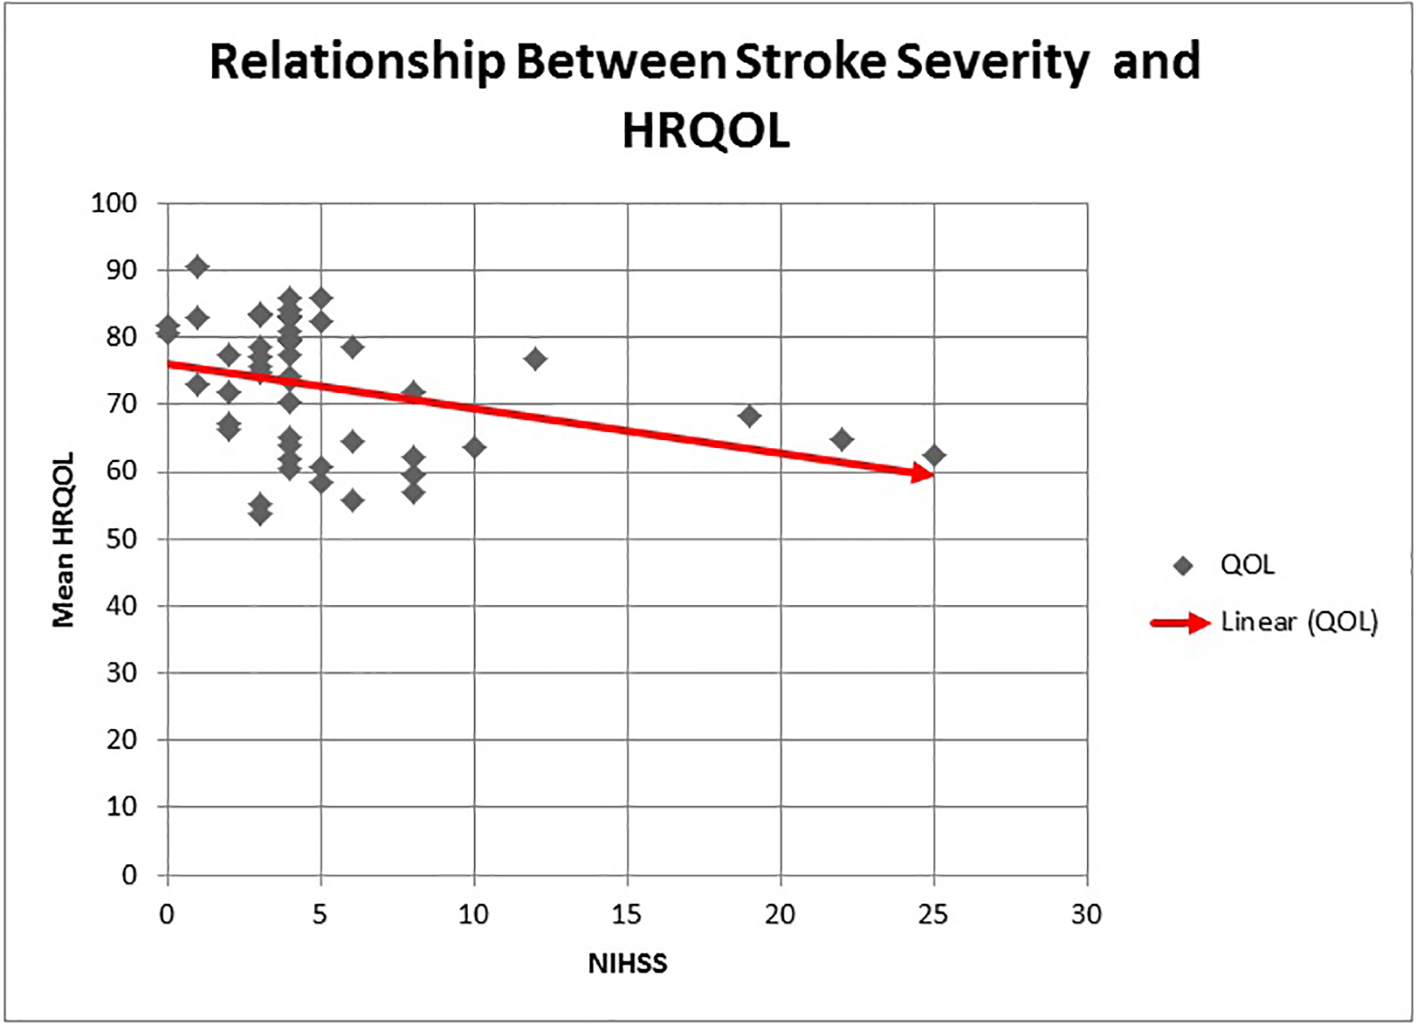
Figure 5. The relationship between stroke severity and HRQOL. An increase in stroke severity as measured by the admission NIHSS is associated with a linear decline in mean HRQOL.
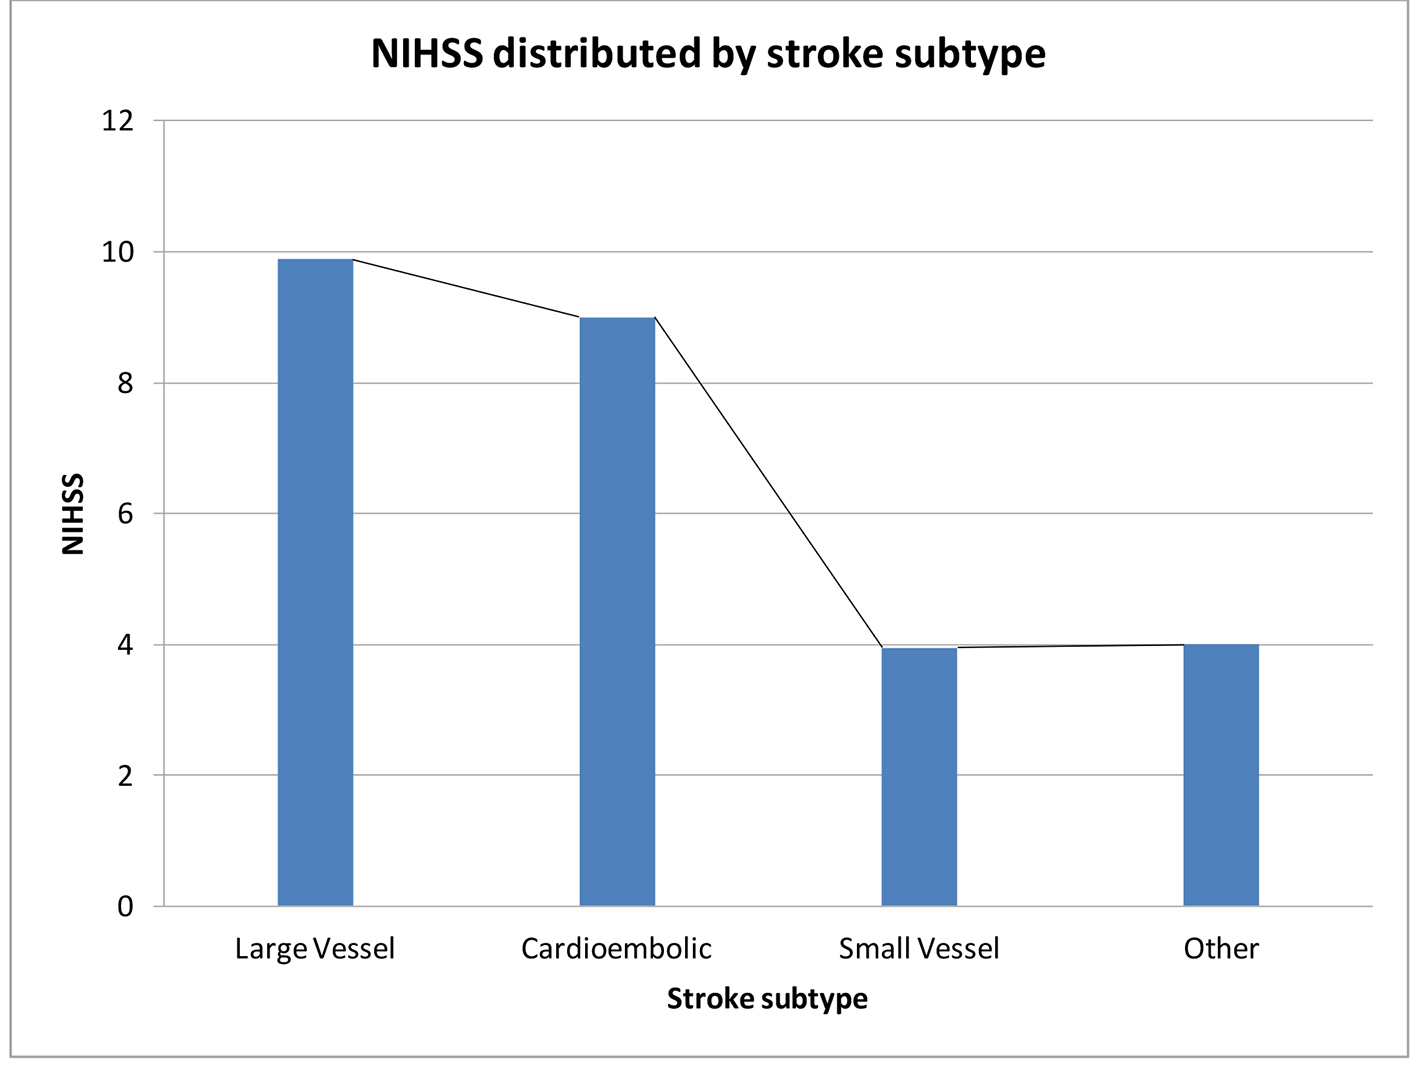
Figure 6. Mean NIHSS within each stroke subtype using the TOAST classification for ischemic stroke. Patients with large artery occlusion and cardioembolic subtypes had significantly higher NIHSS at admission than patients with small artery occlusion subtype of stroke.
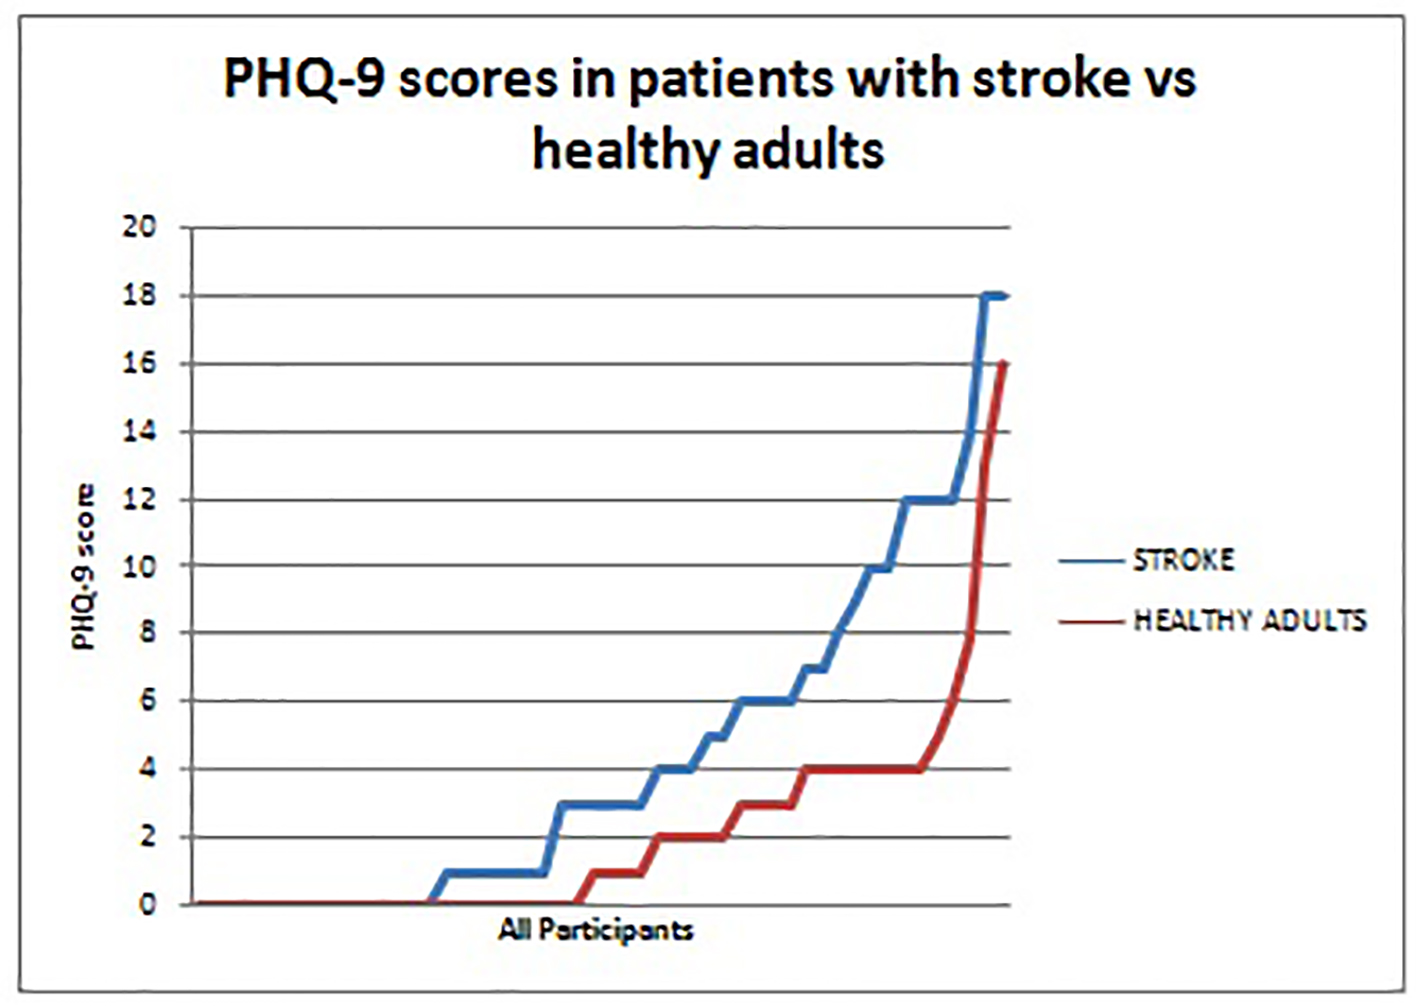
Figure 7. PHQ-9 scores in patients with stroke versus healthy adults. Patients with stroke (blue) consistently had higher PHQ-9 scores than the healthy adults (red). This represents the greater prevalence of depression among stroke survivors when compared to a reference healthy population.
Tables
Table 1. Baseline Demographics and Clinical Information on Stroke Survivors and Apparently Healthy Adults (AHAs)
| Variable | Stroke patients (%) (n = 50) | AHA (%) (n = 50) | Test of significance (P) |
|---|
| Age, years, mean ± SD | 61 ± 17.8 | 60 ± 13.1 | 0.740 |
| Gender | | | |
| Male | 25 (50%) | 15 (30%) | 0.066 |
| Female | 25 (50%) | 35 (70%) | |
| Race | | | |
| Black | 41 (82%) | 47 (94%) | 0.242 |
| Mixed | 3 (6%) | 2 (4%) | |
| Indian | 1 (2%) | 1 (2%) | |
| Asian | 1 (2%) | 0 | |
| Occupation | | | |
| Retired | 22 (44%) | 14 (28%) | 0.586 |
| Teachers | 5 (10%) | 2 (4%) | |
| Unemployed | 4 (8%) | 4 (8%) | |
| Education | | | |
| None | 2 (4%) | 2 (4%) | 0.586 |
| Primary | 21 (42%) | 20 (38%) | |
| Secondary | 16 (32%) | 22 (44%) | |
| Tertiary | 11 (22%) | 7 (14%) | |
| Cardiovascular risk factors | | | |
| Hypertension | 45 (90%) | 50 (100%) | 0.500 |
| Diabetes | 7 (14%) | 6 (12%) | 0.368 |
| Dyslipidemia | 11 (22%) | 12 (24%) | 0.121 |
| Atrial fibrillation | 4 (8%) | 4 (8%) | 0.500 |
| HTN + DM | 6 (12%) | 6 (12%) | 0.620 |
| HTN + DYS | 11 (22%) | 12 (24%) | 0.500 |
| HTN + DYS + DM | 15 (30%) | 9 (18%) | 0.121 |
| Smoking (former and current) | 17 (34%) | 16 (32%) | 0.973 |
| Baseline depression | 2 (4%) | 4 (4%) | 0.678 |
| Newly diagnosed depression | | | |
| Mild (5 - 9) | 10 (20%) | 3 (6%) | 0.0079 |
| Moderate-severe (10 - 19) | 9 (18%) | 2 (4%) | |
Table 2. Difference Between Mean HRQOL in Stroke Survivors Versus Apparently Healthy Adults (AHAs)
| Domains | Stroke patients, mean (SD) | AHAs, mean (SD) | Mean difference (95% CI) | T value | P value |
|---|
| Physical sphere | | | | | |
| Physical | 72.1 (14.52) | 82.3 (12.76) | -10.2 (-15, -4) | -3.75 | 0.0003 |
| Psychoemotional | 73.3 (13.45) | 80.8 (11.68) | -7.44 (-12.4, - 2.44) | -2.95 | 0.004 |
| Cognitive | 71.1 (13.78) | 81.3 (10.81) | -10.2 (-15, -5.23) | -4.10 | 0.0001 |
| Ecosocial interaction | 73.5 (10.47) | 77.4 (9.80) | -3.9 (-7.83, -0.11) | -1.92 | 0.057 |
| Spiritual sphere | | | | | |
| Soul | 76.7 (10.76) | 82.0 (8.17) | -5.3 (-9.14, -1.55) | -2.80 | 0.006 |
| Spirit | 71.8 (16.04) | 79.8 (10.36) | -8.0 (-13.38, -2.66) | -2.97 | 0.0037 |
| Spiritual interaction | 70 (20.24) | 76.9 (17.84) | -6.9 (-14.44, 0.70) | -1.8 | 0.07 |
| HRQOL physical sphere | 72.5 (10.36) | 80.6 (8.62) | -8.1 (-11.7, -4.15) | -4.16 | 0.0001 |
| HRQOL spiritual sphere | 72.8 (13.5) | 79.6 (10.1) | -6.74 (-11.5, -2.00) | -2.82 | 0.005 |
| HRQOL sum | 72.7 (9.80) | 80.0 (7.8) | -7.35 (-10.87, -3.8) | -4.14 | 0.0001 |
Table 3. Correlation of Stroke-Specific Variables With Mean HRQOL
| Variable | Stroke survivors (%) (n = 50) | Mean HRQOL | Test of significance (P) |
|---|
| Prior stroke | 15 (30%) | 68.2 | < 0.05 |
| No prior stroke | 35 (70%) | 74.5 | |
| Stroke subtype | | | |
| Large artery occlusion | 9 (18%) | 66.4 | 0.125 |
| Cardioembolic | 2 (4%) | 67.8 | |
| Small artery occlusion | 38 (76%) | 74.2 | |
| Other | 1 (2%) | 80.8 | |
| Undetermined | 0 | 0 | |
| Newly diagnosed depression | | | |
| Mild (5 - 9) | 10 (20%) | 70.1 | 0.0040 |
| Moderate-severe (10 - 19) | 9 (18%) | 62.8 | |
| NIHSS at admission | | | |
| < 8 (mild) | 41 (82%) | 74.3 | 0.0389 |
| 8 - 14 (moderate) | 6 (12%) | 65.2 | |
| > 17 (severe) | 3 (6%) | 65.2 | |
| Compliance | | | |
| Prescribed antiplatelets | 42 (84%) | 72.7 | < 0.05 |
| Complaint with antiplatelets | 26 (59%) | 75.0 | |
| Prescribed antihypertensives | 44 (88%) | 72.0 | |
| Compliant with antihypertensives | 32 (73%) | 73.1 | |
| Physical rehabilitation | | | |
| < 4 weeks | 35 (75%) | 71.8 | 0.79 |
| > 4 weeks | 15 (30%) | 74.4 | |


