Journal of Neurology Research, ISSN 1923-2845 print, 1923-2853 online, Open Access |
Article copyright, the authors; Journal compilation copyright, J Neurol Res and Elmer Press Inc |
Journal website https://www.neurores.org |
Original Article
Volume 14, Number 2, December 2024, pages 49-58
Assessing Internal Reproducibility Within a Parkinson’s Disease Cohort by Leveraging an Independent Larger Dataset
Figures
Tables
PPMI cohort | Discovery cohort | |
---|---|---|
PPMI: Parkinson’s Progression Markers Initiative; F: female; M: male; SD: standard deviation. | ||
Gender count (%) | M: 242 (66%)/F: 126 (34%) | M: 113 (63%)/F: 66 (37%) |
Age at symptom onset (mean ± SD) | 61.9 ± 8.8 | 59.9 ± 9.4 |
Average current age (mean ± SD) | 61.9 ± 8.8 | 68.7 ± 8.5 |
Disease duration (mean ± SD) | 0.54 ± 0.55 years | 8.8 ± 5.1 years |
Family history of PD count (%) | Yes: 93 (25%)/no: 275 (75%) | Yes: 105 (59%)/no: 74 (41%) |
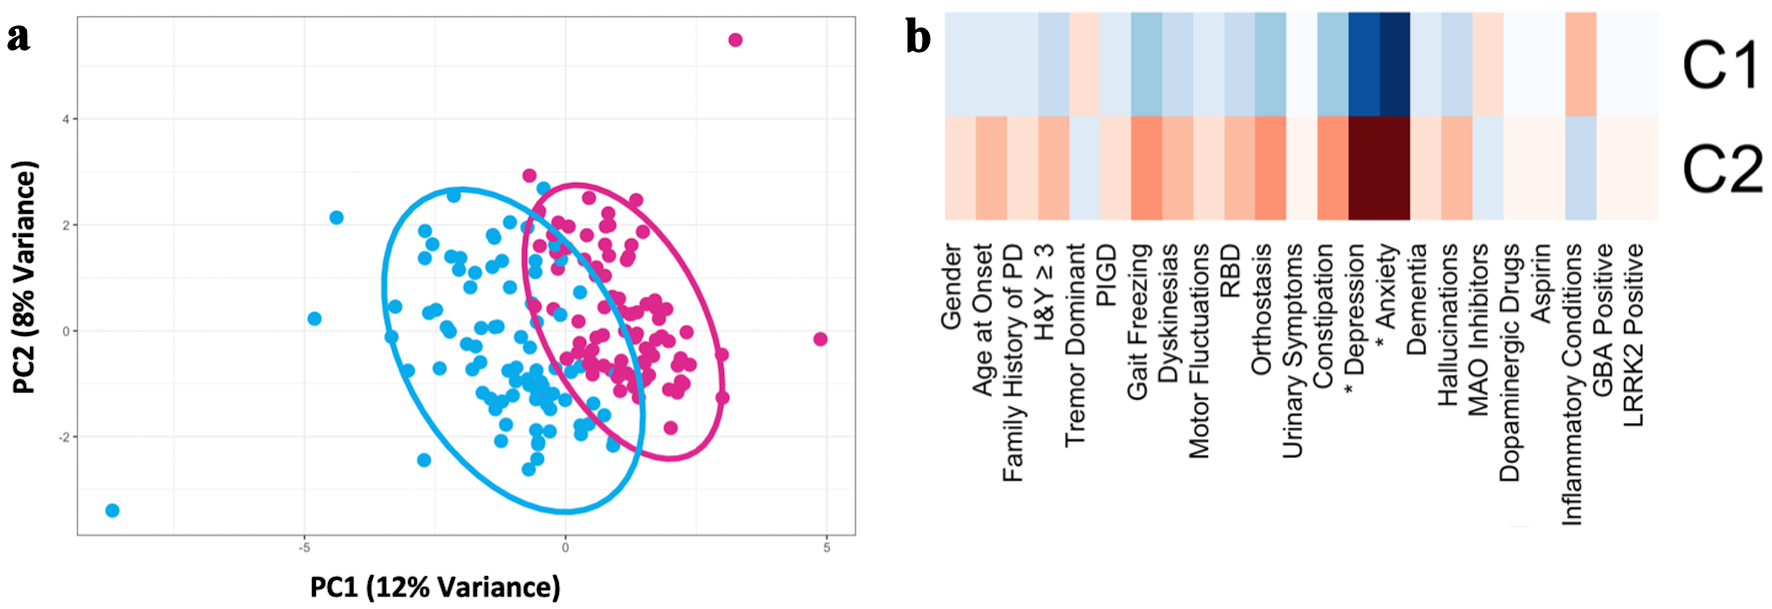
Cluster 1 (n = 92) | Cluster 2 (n = 87) | Uncorrected P value | Bonferroni corrected P value | |
---|---|---|---|---|
Characterization of clinical clusters of the Discovery cohort (n = 179) was based on principal component analysis (PCA) and nonhierarchical k-means clustering analysis. Uncorrected and Bonferoni corrected P values are also shown (traits with P < 0.05 were considered to be significantly different between the two clusters) from Chi-square analysis, unless otherwise specified (tunpaired t-test, WWilcoxon test). aVariables that were collected in both the PPMI and Discovery cohorts. The other traits were determined by chart review (MSMD subset) or by interview (NYU subset). Tremor dominant (TD) and Postural Instability and Gait Disorder (PGID) phenotypes were defined based on Movement Disorder Society-Unified Parkinson’s disease rating scale (MDS-UPDRS) score [13]. F: female; M: male; MAOi: monoamine oxidase inhibitor; RBD: REM-sleep behavior disorder; REM: rapid eye movement; SD: standard deviation. | ||||
Gendera count (%) | M: 63 (68%) | M: 50 (57%) | 0.158 | 1 |
F: 29 (32%) | F: 37 (43%) | |||
Age at diagnosisa (year)t (mean ± SD) | 58.5 ± 9.6 | 61.4 ± 9.0 | 0.0334 | 0.735 |
Disease durationa (year)W (mean ± SD) | 8.7 ± 5.4 | 8.9 ± 4.9 | 0.609 | 1 |
+GBA mutation count (%) | 13 (14%) | 15 (17%) | 0.189 | 1 |
TDa count (%) | 38 (41%) | 22 (25%) | 0.252 | 1 |
PIGD count (%) | 24 (26%) | 32 (37%) | 0.258 | 1 |
Hoehn & Yahr scale (score count) | 1:14 | 1:10 | 0.444 | 1 |
1.5:18 | 1.5:8 | |||
2:52 | 2:44 | |||
2.5:4 | 2.5:10 | |||
3:3 | 3:12 | |||
4:1 | 4:2 | |||
5:0 | 5:1 | |||
Wearing off count (%) | 29 (32%) | 40 (46%) | 0.349 | 1 |
Dyskinesias count (%) | 23 (25%) | 36 (41%) | 0.028 | 0.62 |
Freezing of gait count (%) | 16 (17%) | 39 (45%) | 0.179 | 1 |
Depressiona count (%) | 12 (13%) | 71 (82%) | < 0.001 | < 0.001 |
Anxietya count (%) | 7 (7.6%) | 73 (84%) | < 0.001 | < 0.001 |
Hallucinations count (%) | 6 (6.5%) | 21 (24%) | 0.302 | 1 |
Cognitive impairmenta count (%) | 0 (0%) | 6 (6.9%) | 0.387 | 1 |
Orthostatic hypotensiona count (%) | 20 (22%) | 45 (52%) | 0.015 | 0.33 |
Constipationa count (%) | 46 (50%) | 71 (82%) | 0.059 | 1 |
Urinary symptomsa count (%) | 39 (42%) | 37 (43%) | 0.314 | 1 |
RBDa count (%) | 32 (35%) | 46 (53%) | 0.367 | 1 |
Aspirin count (%) | 18 (19%) | 21 (26%) | 0.15 | 1 |
Dopaminergic agent count (%) | 74 (80%) | 74 (85%) | 0.265 | 1 |
MAOi count (%) | 22 (24%) | 10 (11%) | 0.321 | 1 |
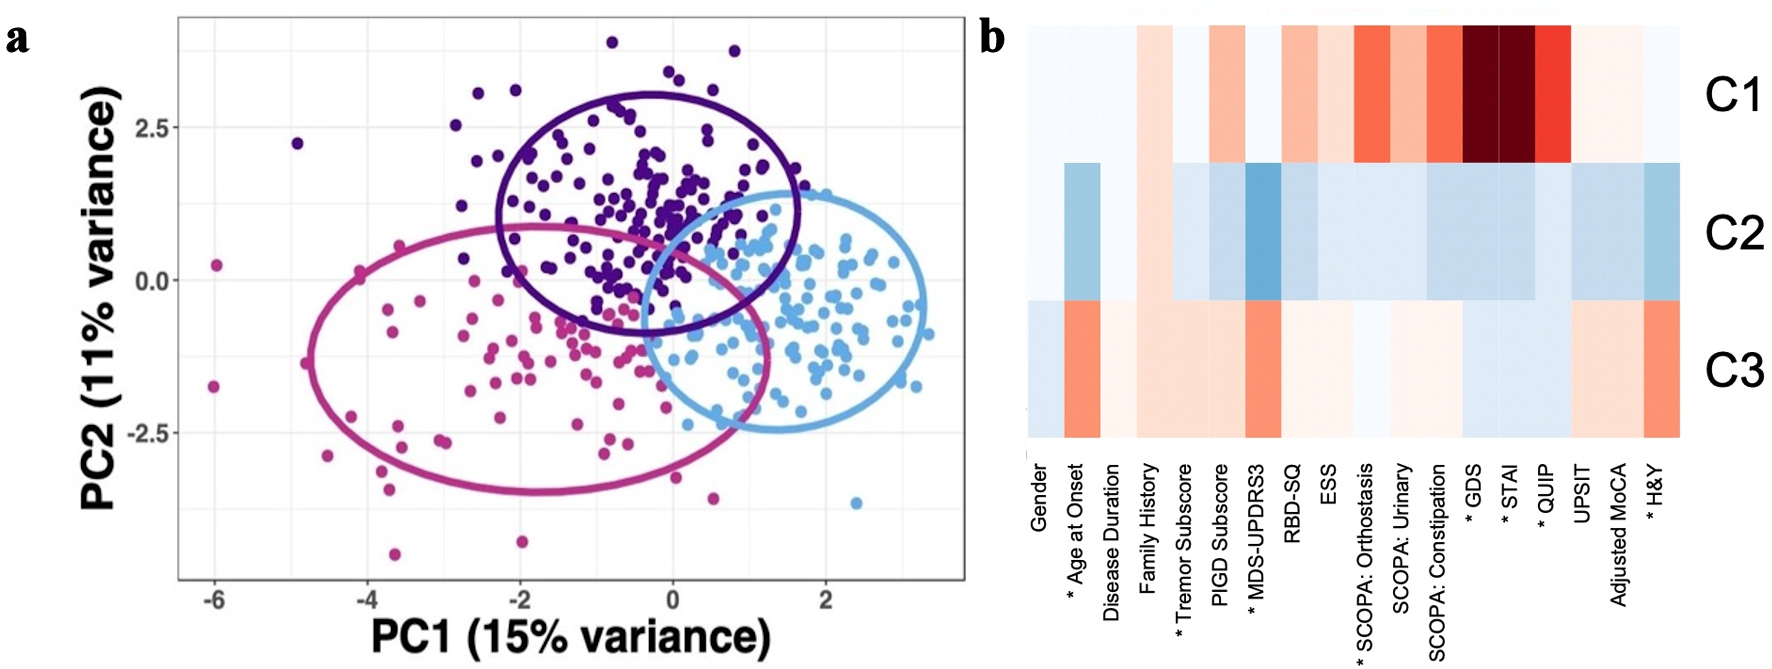
Cluster 1 (n = 71) | Cluster 2 (n = 142) | Cluster 3 (n = 155) | Bonferroni corrected P value | |
---|---|---|---|---|
Characterization of clinical clusters of the PPMI cohort (n = 368) was based on principal component analysis (PCA) and nonhierarchical k-means clustering analysis. Uncorrected and Bonferoni corrected P values are also shown (traits with P < 0.05 were considered to be significantly different between the two clusters) from ANOVA analysis, unless otherwise specified (cChi-square). aVariables that were collected in both the PPMI and Discovery cohorts. bData that were collected from screening visit instead of baseline visit, due to data availability. Tremor dominant (TD) and Postural Instability and Gait Disorder (PGID) phenotypes were defined based on Movement Disorder Society-Unified Parkinson’s disease rating scale (MDS-UPDRS) score [13]. Depression was defined as Geriatric Depression scale (GDS) score ≥ 10. Anxiety was defined as state-Trait Anxiety Inventory (STAI) score > 40. Cognitive impairment was defined as Montreal Cognitive Assessment (MOCA) score ≤ 25. Orthostatic hypotension, constipation, and urinary symptoms each was defined as Outcomes in Parkinson’s Disease-Autonomic Dysfunction (SCOPA-AUT) subscore > 0. REM behavior disorder was defined as REM Sleep Behavior Disorder Screening Questionnaire (RBDSQ) score ≥ 5. Impulse control disorder was defined as MDS-UPDRS subscore > 0. Daytime sleepiness was defined as Epworth Sleepiness Scale > 0. Cognitive impairment was defined as Montreal Cognitive Assessment (MOCA) score ≤ 25. PPMI: Parkinson’s Progression Markers Initiative; F: female; M: male; MAOi: monoamine oxidase inhibitor; RBD: REM-sleep behavior disorder; UPSIT: University of Pennsylvania Smell Identification Test; SD: standard deviation. | ||||
Genderc counta (%) | M: 37 (52%) | M: 90 (63%) | M: 115 (74%) | 0.069 |
F: 34 (48%) | F: 52 (37%) | F: 40 (26%) | ||
Family historyc counta (%) | Y: 20 (28%) | Y: 37 (26%) | Y: 36 (23%) | 1 |
N: 51 (72%) | N: 105 (74%) | N: 119 (77%) | ||
Age at diagnosis (years) (mean ± SD) | 61.1 ± 8.7 | 57.4 ± 7.6 | 66.4 ± 7.5 | < 0.001 |
Disease duration (months) (mean ± SD) | 5.8 ± 5.9 | 6.0 ± 6.3 | 7.2 ± 7.0 | 1 |
Motor symptoms (MDS-UPDRS part 3) (mean ± SD) | 20.9 ± 7.5 | 15.0 ± 5.4 | 26.5 ± 8.0 | < 0.001 |
PIGD (mean ± SD) | 1.5 ± 1.4 | 0.64 ± 0.73 | 1.4 ± 1.2 | 1 |
TD (mean ± SD) | 5.2 ± 3.4 | 4.5 ± 3.0 | 6.5 ± 3.7 | 0.008 |
Hoehn & Yahra scalec (score count) | 1:35 | 1:105 | 1:18 | < 0.001 |
2:36 | 2:37 | 2:135 | ||
3:2 | ||||
Depression (GDS)a (mean ± SD) | 5.9 ± 3.0 | 1.2 ± 1.3 | 1.7 ± 1.2 | < 0.001 |
Anxiety (STAI)a (mean ± SD) | 90.4 ± 17.7 | 57.9 ± 12.0 | 59.6 ± 12.5 | < 0.001 |
Cognitive function (MOCA)a, b (mean ± SD) | 27.1 ± 2.6 | 28.0 ± 1.9 | 26.5 ± 2.4 | 0.101 |
Orthostatic hypotension (SCOPA-AUT)a (mean ± SD) | 0.99 ± 1.2 | 0.28 ± 0.54 | 0.41 ± 0.67 | < 0.001 |
Constipation (SCOPA-AUT)a (mean ± SD) | 1.9 ± 1.6 | 0.47 ± 0.78 | 1.2 ± 1.1 | 0.277 |
Urinary symptoms (SCOPA-AUT)a (mean ± SD) | 6.2 ± 6.6 | 3.2 ± 2.2 | 5.0 ± 4.9 | 1 |
Impulse control disorder (mean ± SD) | 0.77 ± 1.02 | 0.15 ± 0.36 | 0.14 ± 0.40 | < 0.001 |
Daytime sleepiness (mean ± SD) | 6.8 ± 4.0 | 5.1 ± 3.2 | 6.1 ± 3.6 | 1 |
RBD (RBDSQ)a (mean ± SD) | 5.3 ± 2.9 | 3.1 ± 2.0 | 4.5 ± 2.8 | 1 |
Smell function (UPSIT) (mean ± SD) | 21.2 ± 8.2 | 25.2 ± 7.7 | 20.0 ± 7.9 | 0.319 |