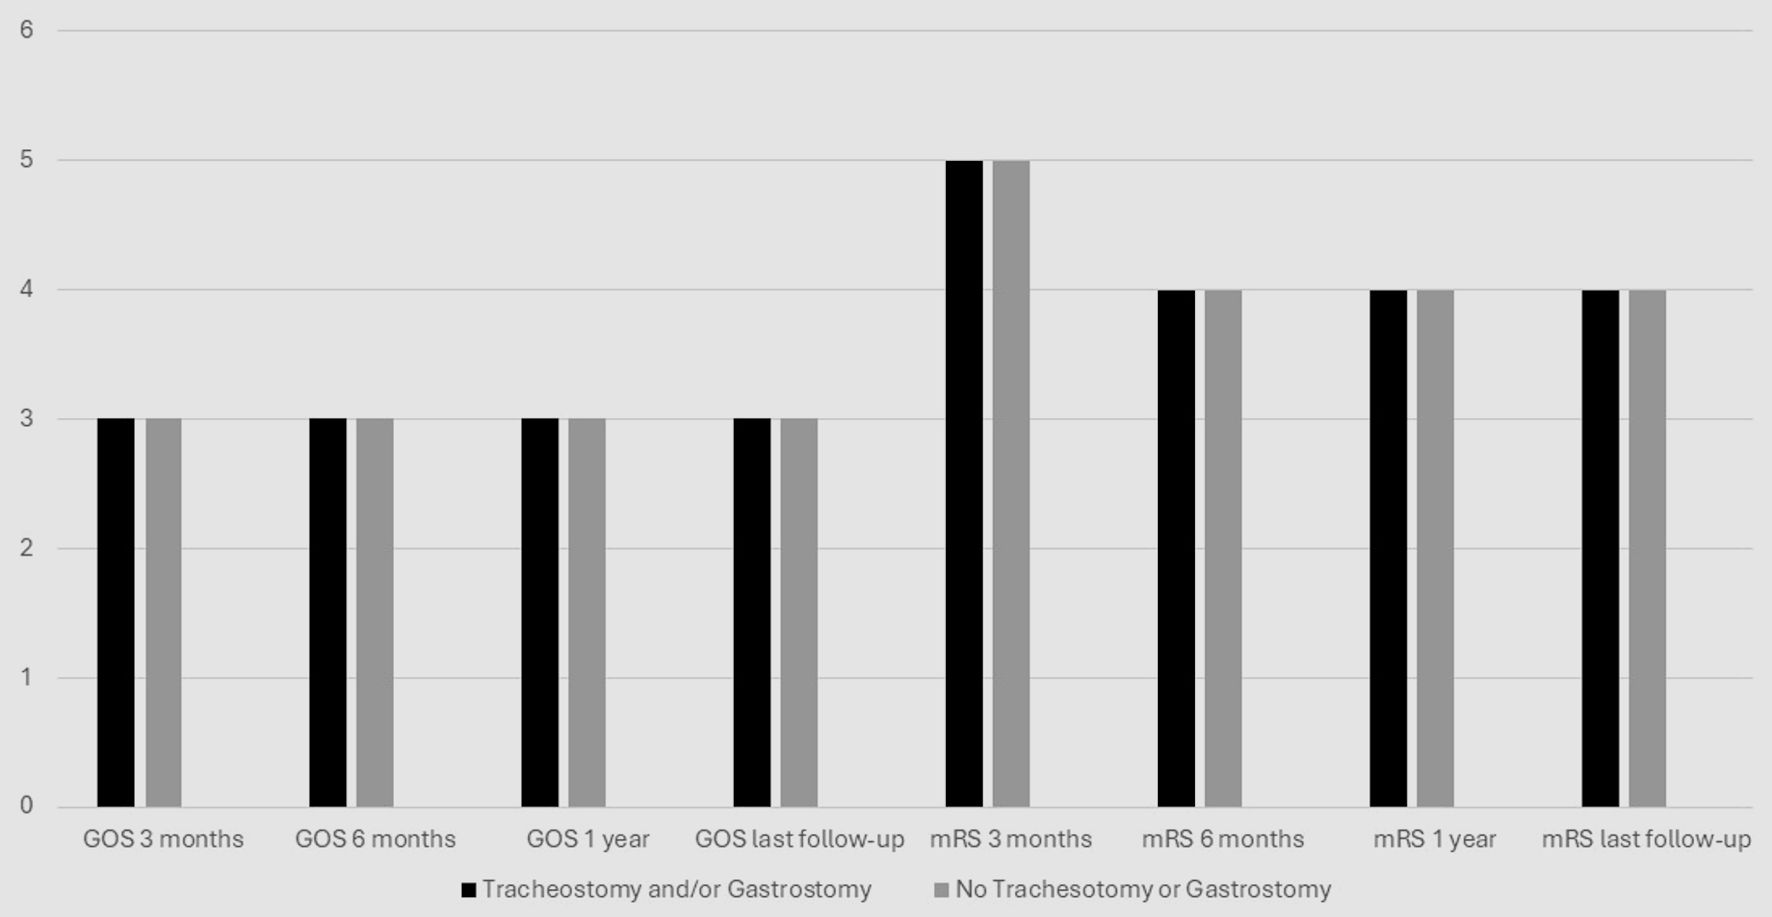
Figure 1. GOS/mRS outcomes over time. GOS: Glasgow Outcome Scale; mRS: modified Rankin Scale.
| Journal of Neurology Research, ISSN 1923-2845 print, 1923-2853 online, Open Access |
| Article copyright, the authors; Journal compilation copyright, J Neurol Res and Elmer Press Inc |
| Journal website https://www.neurores.org |
Original Article
Volume 14, Number 2, July 2024, pages 59-67
Tracheostomy and Gastrostomy After Decompressive Craniectomy: What Surrogates Need to Know
Figures
Tables
| Characteristic | T (n = 26) | G (n = 29) | T and/or G (n = 34) | No T or G (n = 32) | P value |
|---|---|---|---|---|---|
| T: tracheostomy; G: gastrostomy; SICU: surgical intensive care unit; NSICU: neuroscience intensive care unit; IPR: inpatient rehabilitation; SNF: skilled nursing facility; LTACH: long-term care hospital; GCS: Glasgow Coma Scale; IQR: interquartile range. | |||||
| Age (median; IQR 25 - 75, in years) | 45; 30 - 54 | 48; 37.5 - 58.5 | 48; 33.5 - 57.5 | 50; 37 - 61 | 0.1356 |
| Sex | 0.9509 | ||||
| Male | 18 (69.2%) | 17 (58.6%) | 21 (61.8%) | 20 (62.5%) | |
| Female | 8 (31.8%) | 12 (41.4%) | 13 (38.2%) | 12 (37.5%) | |
| Etiology | 0.6786 | ||||
| Trauma | 11 (42.3%) | 12 (41.4%) | 13 (38.2%) | 6 (18.7%) | |
| Ischemic stroke | 8 (31.8%) | 8 (27.6%) | 12 (35.3%) | 15 (46.8%) | |
| Hemorrhagic stroke | 7 (26.9%) | 9 (31.0%) | 9 (26.5%) | 11 (34.3%) | |
| Dominant hemisphere surgery | 11 (42.3%) | 10 (34.5%) | 13 (38.3%) | 9 (28.1%) | 0.2102 |
| Admission service | 0.0805 | ||||
| Trauma/SICU | 15 (57.7%) | 13 (44.8%) | 16 (47.1%) | 9 (28.1%) | |
| Neurosurgery | 6 (23.1%) | 8 (27.6%) | 9 (26.5% | 6 (18.7%) | |
| Internal medicine | 0 (0.0%) | 1 (3.4%) | 1 (2.9%) | 0 (0.0%) | |
| Neurology/NSICU | 5 (8.9%) | 7 (24.1%) | 8 (23.5% | 17 (53.1%) | |
| Admission GCS | 0.0832 | ||||
| 3 to 7 | 15 (57.7%) | 19 (65.5%) | 20 (58.8%) | 12 (37.5%) | |
| 8 to 15 | 11 (42.3%) | 10 (34.5%) | 14 (41.2%) | 20 (62.5%) | |
| Preoperative GCS | 0.085 | ||||
| 3 to 7 | 20 (76.9%) | 21 (72.4%) | 25 (73.5) | 17 (53.1%) | |
| 8 to 15 | 6 (23.1%) | 8 (27.6%) | 9 (26.5%) | 15 (46.9%) | |
| Discharge disposition | 0.128 | ||||
| Home, independent | 3 (11.5%) | 2 (6.8%) | 3 (8.8%) | 3 (9.4%) | |
| IPR | 9 (34.6%) | 15 (51.7%) | 15 (44.1%) | 12 (37.5%) | |
| SNF | 1 (3.8%) | 2 (6.8%) | 3 (8.8%) | 2 (6.3%) | |
| LTACH | 7 (26.9%) | 7 (24.1%) | 7 (20.6%) | 1 (3.1%) | |
| Transferred | 0 (0.0%) | 0 (0.0%) | 0 (0.0%) | 1 (3.1%) | |
| Died | 6 (23.1%) | 2 (6.8%) | 6 (17.6%) | 13 (40.6%) | |
| Event | Tracheostomy and/or gastrostomy (n = 34) | No tracheostomy or gastrostomy (n = 32) | P value |
|---|---|---|---|
| P value represents statistical comparison of tracheostomy or gastrostomy data to no tracheostomy or gastrostomy data. IQR: interquartile range (from 25th percentile to 75th percentile). | |||
| Hours from admission to decompression (median) | 17.25 (IQR: 3 - 50.97) (n = 34) | 23.75 (IQR: 9.64 - 48.73) (n = 32) | 0.2299 |
| Days from decompression to gastrostomy (median) | 10 (IQR: 7 - 16) (n = 29) | - | - |
| Days from decompression to tracheostomy (median) | 7 (IQR: 3 - 11) (n = 26) | - | - |
| Days from decompression to comfort care (median) | 46.5 (IQR: 15.5 - 252) (n = 3) | 4 (IQR: 2 - 6.5) (n = 10) | 0.2861 |
| Cause of death | T (n = 6) | G (n = 2) | T and/or G (n = 6) | No T or G (n = 13) |
|---|---|---|---|---|
| P = 0.3204 for comparison of tracheostomy and/or gastrostomy to no tracheostomy or gastrostomy. ICP: intracranial pressure; T: tracheostomy; G: gastrostomy. | ||||
| Stable with withdraw of care | 0 (0.0%) | 0 (0.0%) | 0 (0.0%) | 2 (15.4%) |
| Not medically stable | 1 (16.8%) | 0 (0.0%) | 1 (16.7%) | 2 (15.4%) |
| Elevated ICP - withdrawal of care | 3 (50%) | 1 (50.0%) | 3 (50.0%) | 8 (61.5%) |
| Brain death | 2 (33.3%) | 1 (50.0%) | 2 (33.3%) | 1 (6.7%) |